Step 10. Sales and demand forecasting: Forecaster-> Data review and setup
Data – Sales and Demand Forecasting
Use the Data screen to review uploaded data, assign “Like” products to products without sales history and eventually reload your data files.
Forecaster Data – Inventory Demand Forecasting
Use the Data screen to review uploaded data, review sales charts and eventually reload your data files.
Video (screen is the same as screen Trainer->Data):
Products
Details of uploaded products file are reviewed on primary screen and screen consists of elements listed below. Products file can be reviewed, again adjusted out of the system if needed and eventually reloaded by clicking on the button Reload and validate in the right top corner. Source Data screen displays all data uploaded in the previous step. User can review all the uploaded data and also when the first and last sale occurred for the respective product.
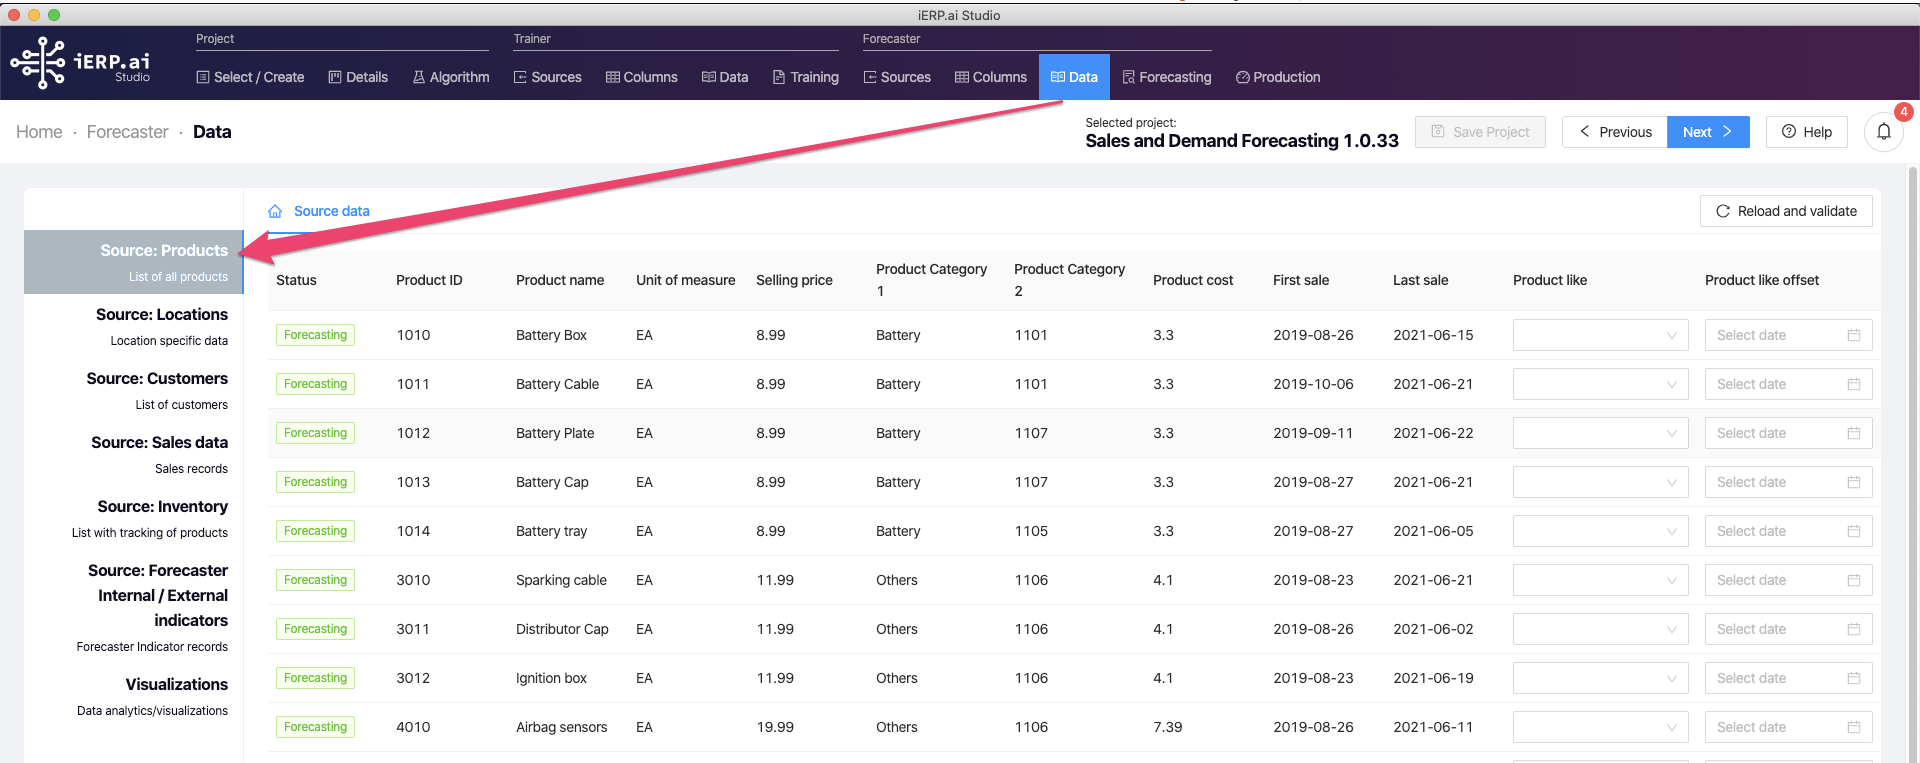
Products Like functionality
This functionality is allowing users to generate the forecast for products without sales history by associating existing product from similar product line to the new product. User can select a date from which he/she wants to adopt history of another product and forecaster will generate sales forecast based on historical data of selected Like product.
Product like assignment
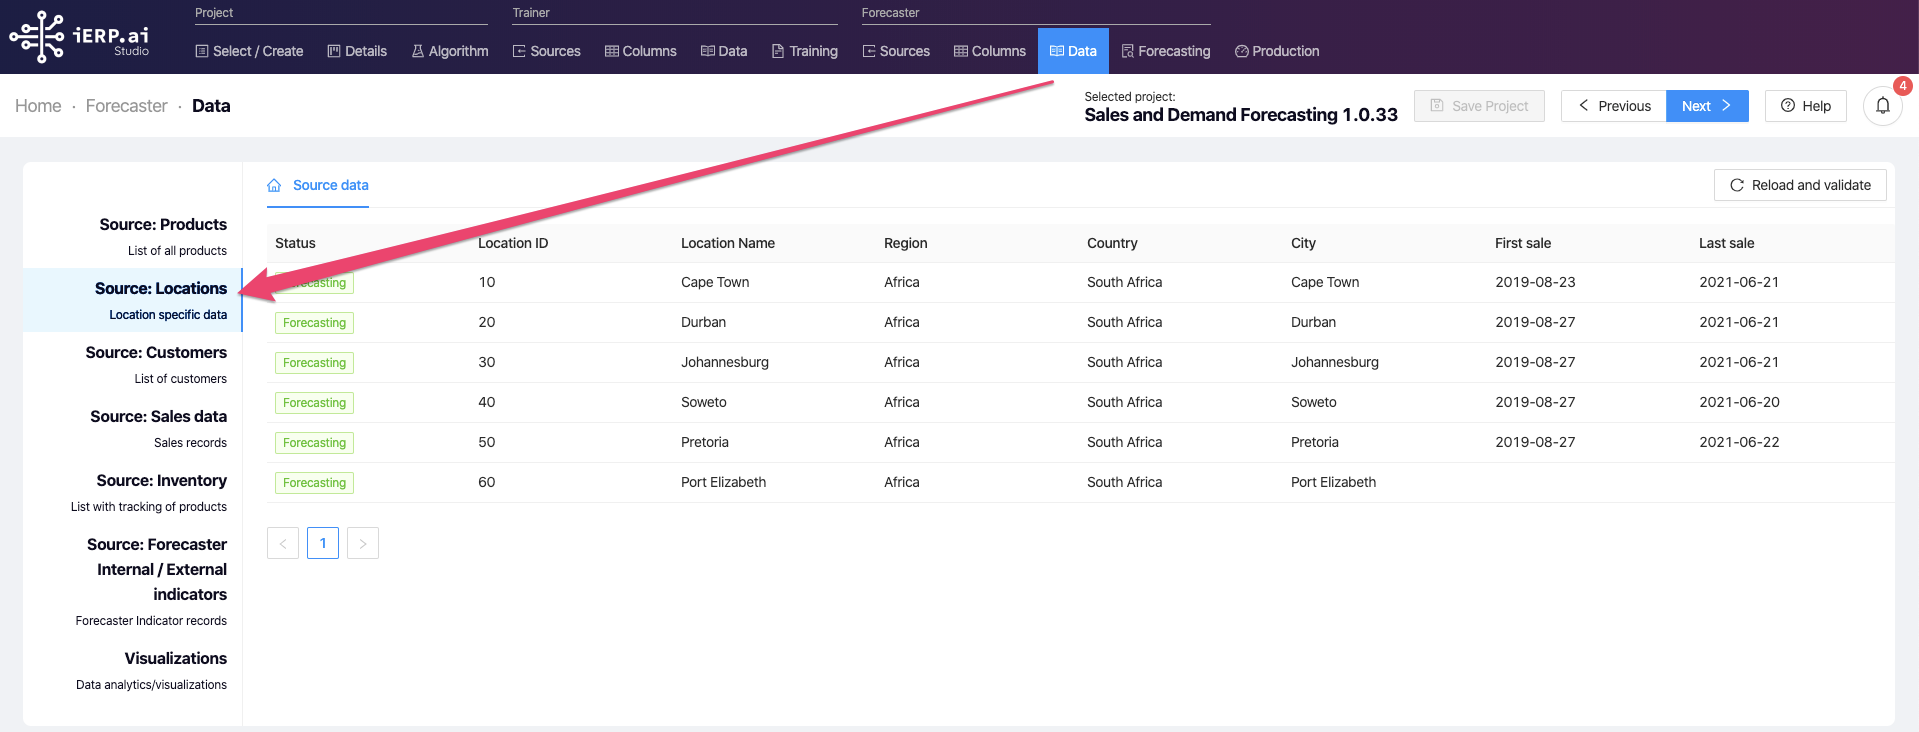
Locations
Details of uploaded locations file are reviewed on Location tab. Location records can be reviewed, again adjusted in the CSV file if needed and eventually reloaded by clicking on the button Reload in the right top corner. Locations file is listing all physical locations to be processed by an algorithm where you want to perform training and forecasting. User can review all the uploaded data and also when the first and last sale occurred in the respective location.
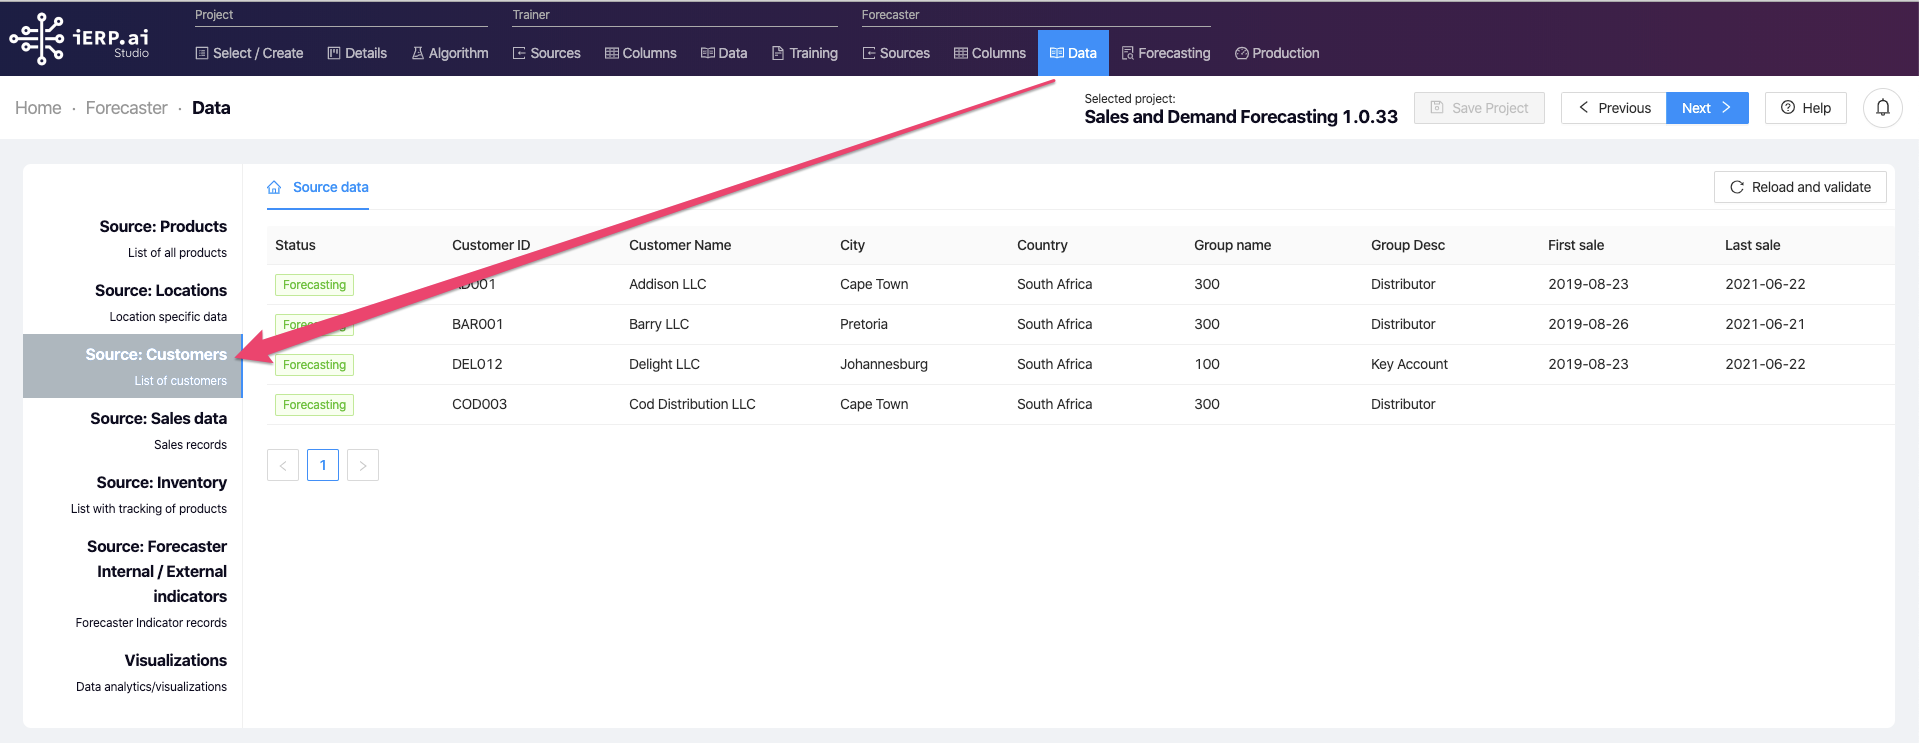
Customers
Details of uploaded customer file are reviewed on the Customer tab. Customers records can be reviewed, again adjusted out of the system if needed and eventually reloaded by clicking on the button Reload and validate in the right top corner. User can review all the uploaded data and when the first and last sale occurred for the respective customer.
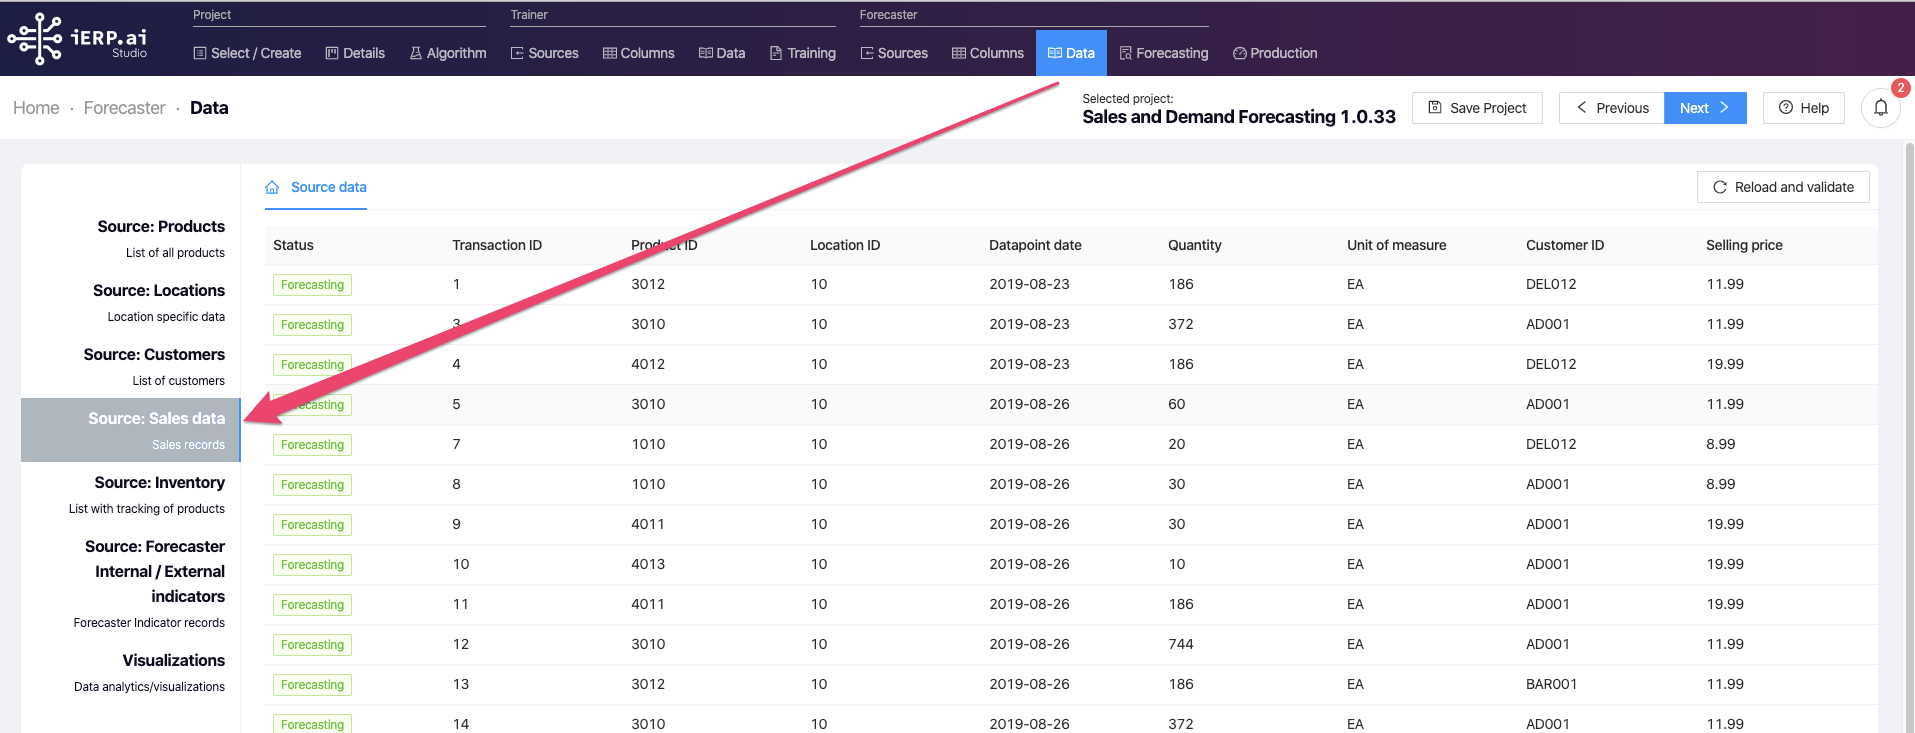
Sales Data
User can review individual lines uploaded as historical sales data. Sales data file can be reviewed, again adjusted out of the system if needed and eventually reloaded by clicking on the button Reload and validate in the right top corner.
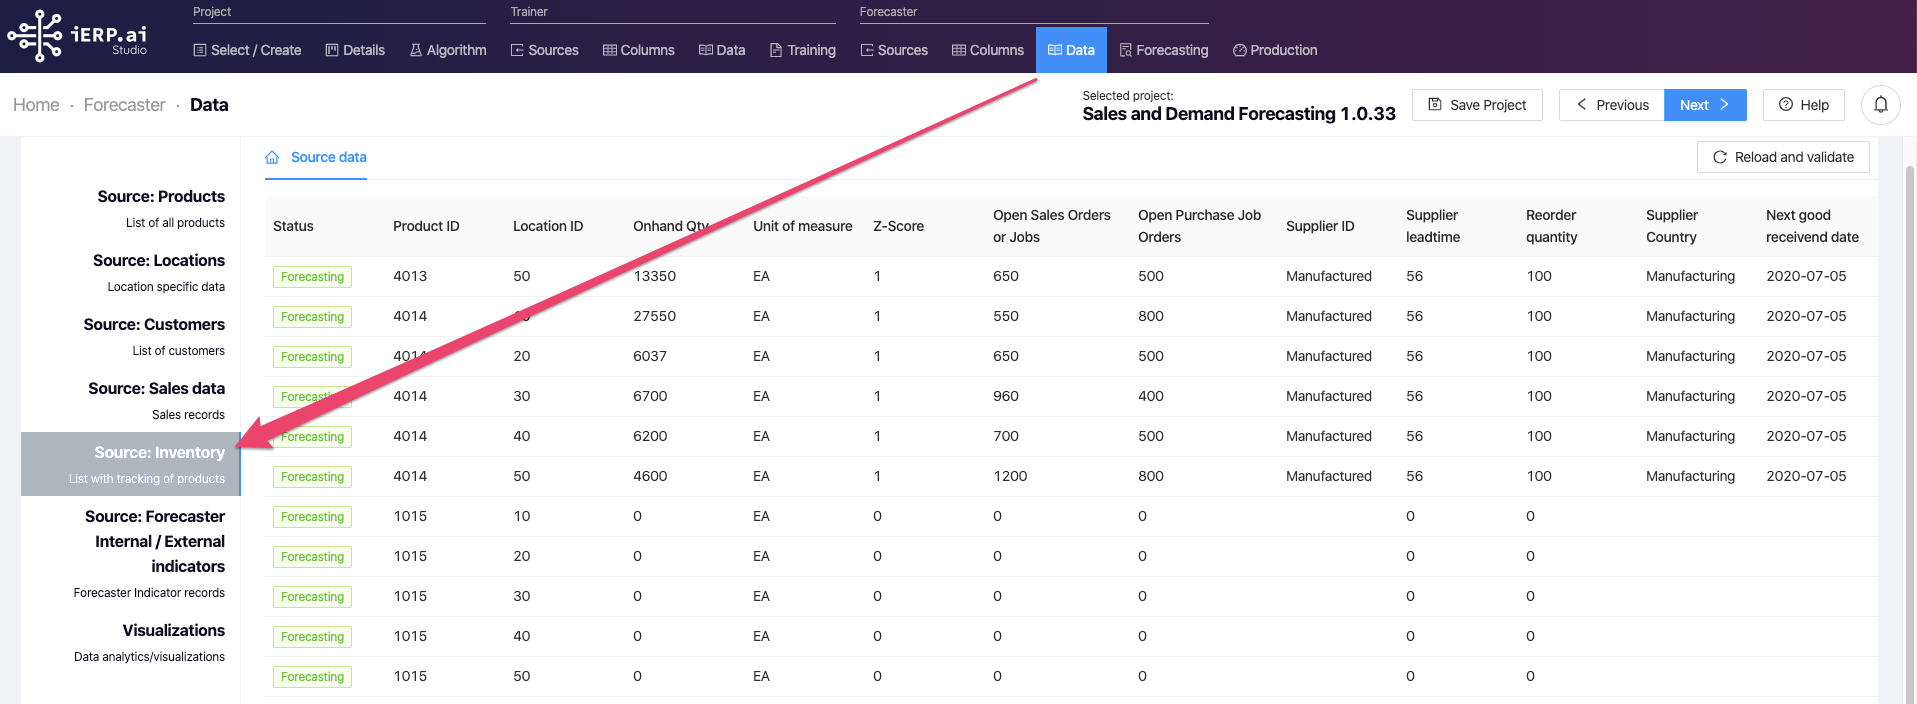
Inventory
User can review individual lines uploaded as a snapshot of the current situation in inventory. Inventory data file can be reviewed, again adjusted out of the system if needed and eventually reloaded by clicking on the button Reload and validate in the right top corner. Inventory file is listing on-hand status for all products in all locations along with open sales orders and purchase orders.
Indicators
Indicators file is listing all internal indicators (historical and also future) to be used during forecasting. External indicators selected during algorithm selection will be automatically added to this file (no user action needed) however internal indicators like holidays, breakdowns, promotions, and others have to be added to the CSV file by the user or extracted from the ERP system.
Visualizations in Forecaster->Data
Visualizations are providing the user with advanced consolidated sales statistics and are used to review sales data.
Visualization on ‘Data’ tab on ‘Forecaster’ section is Advance business intelligence for users to get an instant overview of sales in all locations, for all customers and all products. Visualization is different from the one in ‘Training->Data’ section as it contains many more charts and advance analytics features.
Visualization consist of the following elements:
- Overview of sales this week, this month, this quarter and this year and comparison to the previous period.
- All locations sale and specific location sales data.
- All products sale and specific product sales data.
- All customer sales and specific customers sales data.